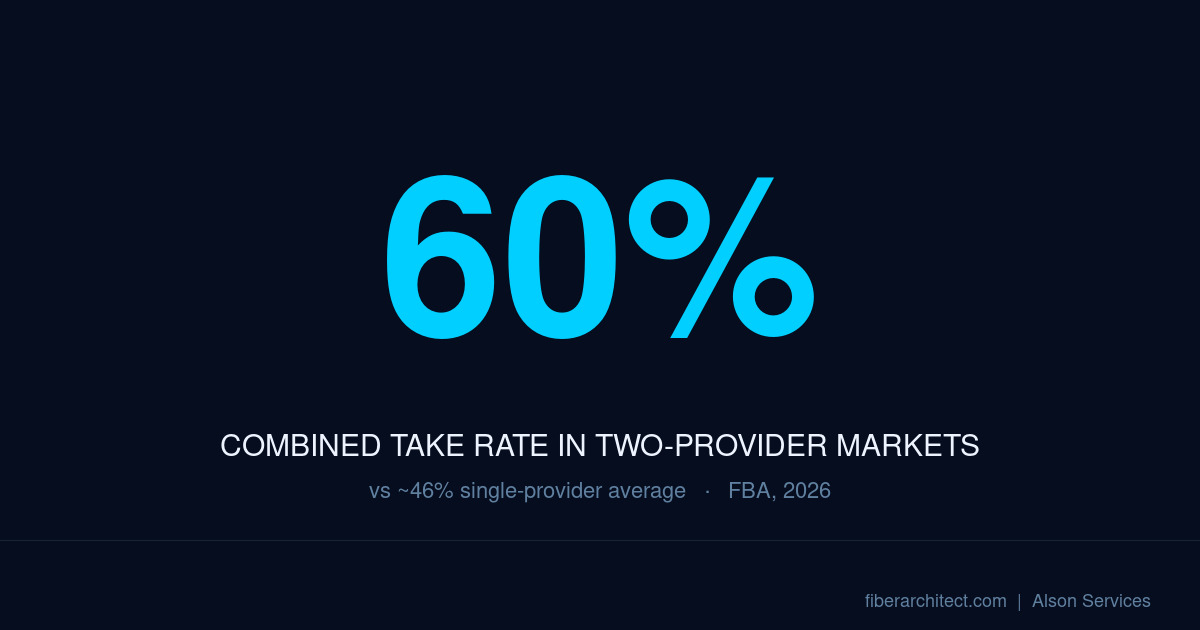
Markets with a single fiber provider average take rates in the mid-40% range. Add a second fiber provider to the same market and combined take rates climb to roughly 60% [FBA, 2025 North American FTTH Deployment and Market Update, 2026]. That 15-point gap is not a coincidence. It is the measurable effect of competition on consumer adoption, and it has direct implications for how ISPs should think about market entry timing.
The Market Structure Shift Behind the Number
Non-Tier 1 providers now account for approximately 40% of cumulative U.S. FTTH passings, up from 12% in 2007 [FBA, 2026]. Regional telcos, electric cooperatives, municipalities, and competitive challengers have collectively become a major force in fiber expansion. Many of these operators are entering markets that already have one fiber provider, creating the two-provider dynamics that the FBA data captures.
The implication for ISPs evaluating overbuild targets is this: entering a market where one fiber provider exists does not split the available subscribers evenly between two networks. It expands the total subscriber pool. Consumers who did not switch from cable or fixed wireless to the first provider often switch when a second option appears. The presence of competition changes the purchasing behavior of a segment that passivity and inertia had kept with incumbent technology.
What This Means for Service Area Sequencing
An ISP entering a market with an existing fiber provider should not model take rate using single-provider benchmarks. The combined 60% figure represents total market capture across both networks, not each network individually. The entering ISP's capture depends on its pricing, service quality, and marketing execution relative to the incumbent.
The strategic question is which specific corridors within the target market have the highest concentration of subscribers who have not yet adopted fiber. Those corridors offer the best return on overbuild investment because they represent addressable demand that the incumbent has not converted. A cost-per-pass model that incorporates existing-provider coverage data by address identifies those corridors before design begins.
What Changes on Monday Morning
For network planners evaluating overbuild candidates, the FBA data provides a credible basis for modeling take rate in two-provider markets that is significantly more optimistic than single-provider assumptions. A feasibility model built on mid-40% take rate projections will underestimate the addressable market in corridors with an existing fiber incumbent.
The other implication is timing. Non-Tier 1 providers have captured a large and growing share of the market precisely because they moved into geographies before Tier 1 incumbents completed their builds. The markets that still offer low-competition entry are narrowing. That window is a design and capital planning decision, not a marketing decision.
U.S. fiber is on pace to become the leading fixed-internet delivery method by 2028, and the providers that model for competitive dynamics rather than against them will shape which markets get built and which stay dark.